From Wikipedia, the free encyclopedia
2004 European Parliament election in Belgium
First party
Second party
Leader
Jean-Luc Dehaene
Frank Vanhecke
Party
CD&V
Vlaams Blok
Alliance
EPP
Last election
3 seats, 13.49%
2 seats, 9.39%
Seats won
4
3
Seat change
Popular vote
1,131,119
930,731
Percentage
17.43%
14.43%
Swing
Third party
Fourth party
Leader
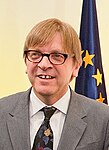
Guy Verhofstadt
Elio Di Rupo
Party
Open Vld
PS
Alliance
ALDE
PES
Last election
3 seats, 13.61%
3 seats, 9.59%
Seats won
3
4
Seat change
Popular vote
880,279
878,577
Percentage
13.56%
13.54%
Swing
Elections to the European Parliament were held in Belgium on 13 June 2004. The elections produced little overall change in the distribution of seats in the European Parliament among Belgium's many political parties. The two socialist parties improved their vote, while the Green parties lost ground. The Flemish nationalist party the Flemish Bloc (Vlaams Blok) registered the largest gains.
Party Votes % Seats French-speaking electoral college Socialist Party 878,577 36.09 4 Reformist Movement 671,422 27.58 3 Humanist Democratic Centre 368,753 15.15 1 Ecolo 239,687 9.84 1 National Front 181,351 7.45 0 New Belgian Front 26,775 1.10 0 Rassemblement Wallonie France 23,090 0.95 0 Francophone Christian Democrats 19,718 0.81 0 Workers' Party of Belgium 19,645 0.81 0 Movement for a Socialist Alternative 5,675 0.23 0 Total 2,434,693 100.00 9 Dutch-speaking electoral college Christian Democratic and Flemish –New Flemish Alliance 1,131,119 28.15 4 Vlaams Blok 930,731 23.16 3 Flemish Liberals and Democrats –Vivant 880,279 21.91 3 Socialist Party Differently –Spirit 716,317 17.83 3 Green! 320,874 7.99 1 Workers' Party of Belgium 24,807 0.62 0 Left Socialist Party 14,166 0.35 0 Total 4,018,293 100.00 14 German-speaking electoral college Christian Social Party 15,722 42.49 1 Partei für Freiheit und Fortschritt –Reformist Movement 8,434 22.79 0 Socialist Party 5,527 14.94 0 Ecolo 3,880 10.49 0 Non-Party Young Independents–PDB 3,442 9.30 0 Total 37,005 100.00 1 Valid votes 6,489,991 94.63 Invalid/blank votes 367,995 5.37 Total votes 6,857,986 100.00 Registered voters/turnout 7,552,240 90.81 Source: Belgian Elections
1979 1984 1989 1994 1999 2004 2009 2014 2019 2024 2029
Austria
Belgium
Bulgaria
Croatia
Cyprus
Czech Republic
Denmark
Estonia
Finland
France
Germany
Greece
Hungary
Ireland
Italy
Latvia
Lithuania
Luxembourg
Malta
Netherlands
Poland
Portugal
Romania
Slovakia
Slovenia
Spain
Sweden Off-year


